JMeter allows you to simulate a high number of users or requests to evaluate the performance, scalability, and reliability of the target system without worrying about underlying server configuration used for doing performance testing .Let’s walkthrough how to do it
Summary
- JMeter is primarily designed to simulate multiple users interactions with a web application or server to measure its performance and identify bottlenecks and potential issues under different load conditions.
- JMeter allows users to define the number of virtual users, ramp-up period, and loop count to simulate various load levels and scenarios to observe the application’s behavior under different condition.
for more details of JMeter refer this given link JMeter
What is JMeter Test?
- JMeter is an open-source performance testing tool developed by Apache.
- A JMeter Test refers to the process of using JMeter to conduct performance testing on a software application or system.
- It allows you to simulate a high number of users or requests to evaluate the performance, scalability, and reliability of the target system.
Why to use JMeter Test?
- It allows you to push your application to its limits by generating extreme user loads and analyzing how it responds under stress conditions. This helps identify the breaking points and potential failure scenarios.
- JMeter allows you to simulate a large number of users accessing your application simultaneously, helping you evaluate its performance under various load conditions.
Benefits
The benefits of JMeter testing in aiTest include
- aiTest, in combination with JMeter, allows you to optimize your application’s performance.
- aiTest’s performance analytics offer a wide range of analytics and insights, including test status, test analytics, UI analysis, and application performance analysis.
- It helps measure response times, throughput, and resource consumption under different loads and stress conditions. You can identify performance bottlenecks and optimize your URLs to improve efficiency. This leads to faster response times, smoother user experience, and increased user satisfaction.
How to Create Testrun in JMeter Test?
- Sign up using your E-mail or Google account.
- Go to
JMeter Test
- Hit the Create Test button.
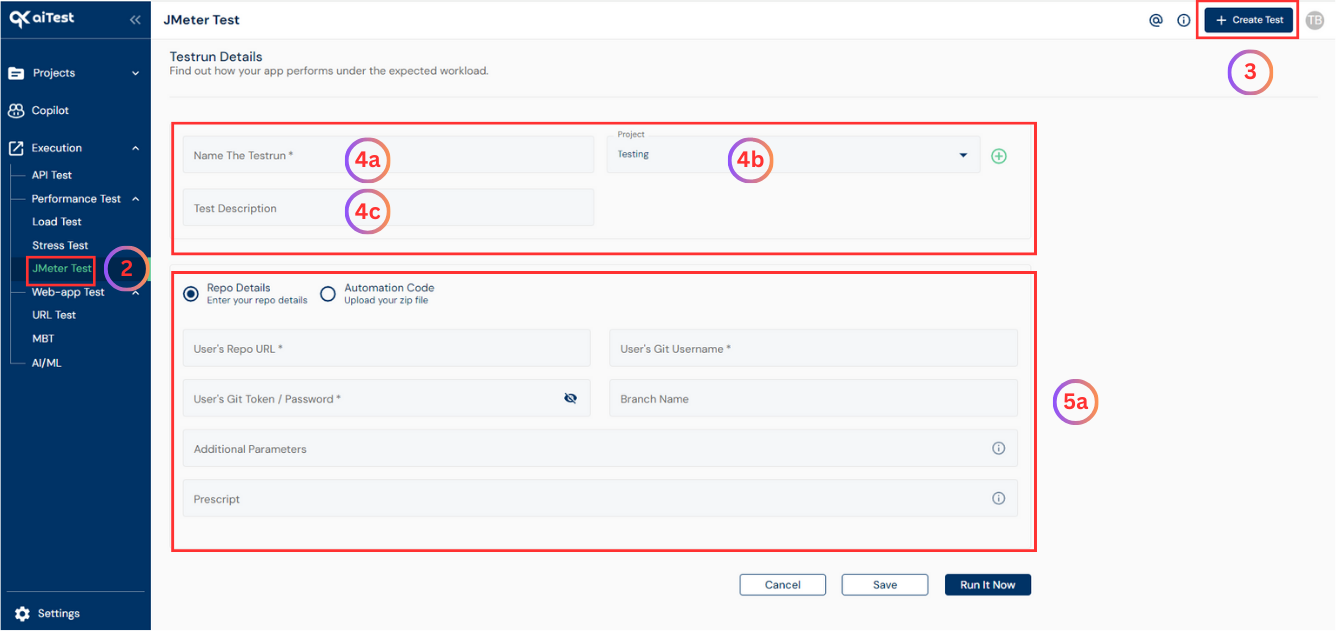
- Configure your test
- a)Name the testrun: Give the name of testrun whatever you want or which is related to your application, So that it will be easy to get that particular testrun details whenever you want. i.e. test-example.com, test-demo.com, etc.
- b)Project: Select a project in which you want to run your test or you can create a project by clicking on the red colored plus sign(+) button.
- c)Test Description: Write some testrun description to make your testrun more informative.
- You can choose to enter Repo Details or JMeter script.
- a) If you choose Repo Details you will need to fill User’s Repo URL, User’s Git Username , User’s Git Token / Password, Branch Name & Additional Parameters.
- b) If you choose JMeter script you will need to upload your JMeter file and add the Additional Parameters.
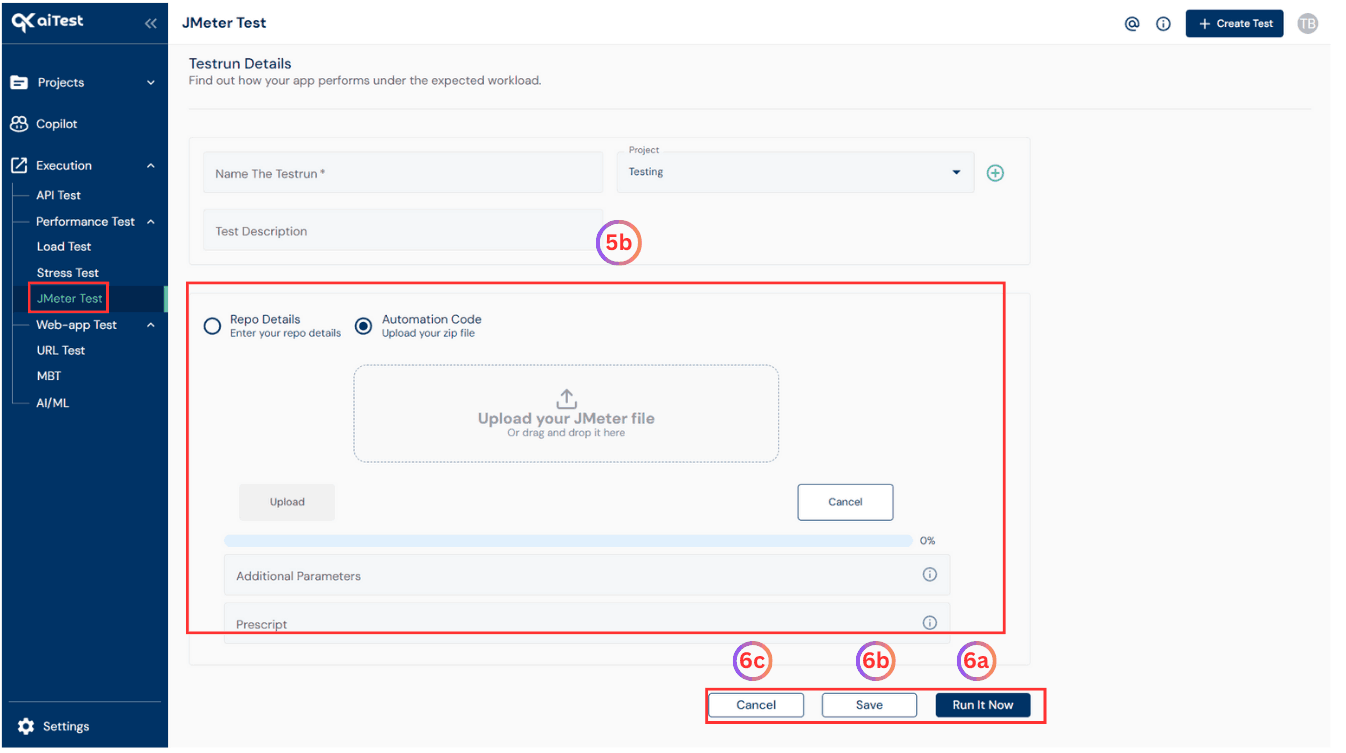
- Once you are done with the above steps you can do either of the following:
- a) Run It Now : Immediately run the JMeter script against the configuration.
- b) Save: Save the configuration for later run as draft testrun.
- c) Cancel: Reset and go back to dashboard page.
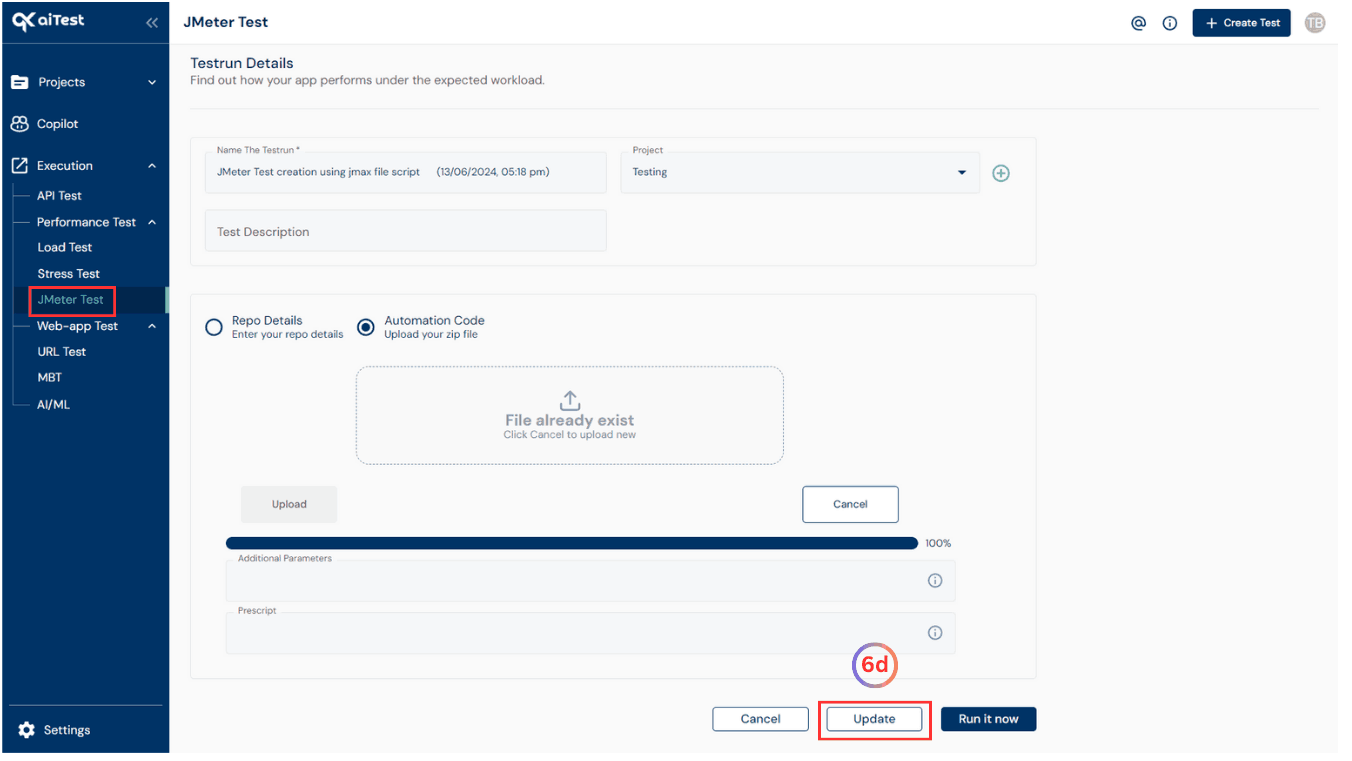
- d) Update: Update the configurations of the saved draft testrun.
Run Analysis
After the testrun is completed, you can access the Run Analysis to review the results.
Here’s how:
- Go to the JMeter Test dashboard to see an overview of the test results.
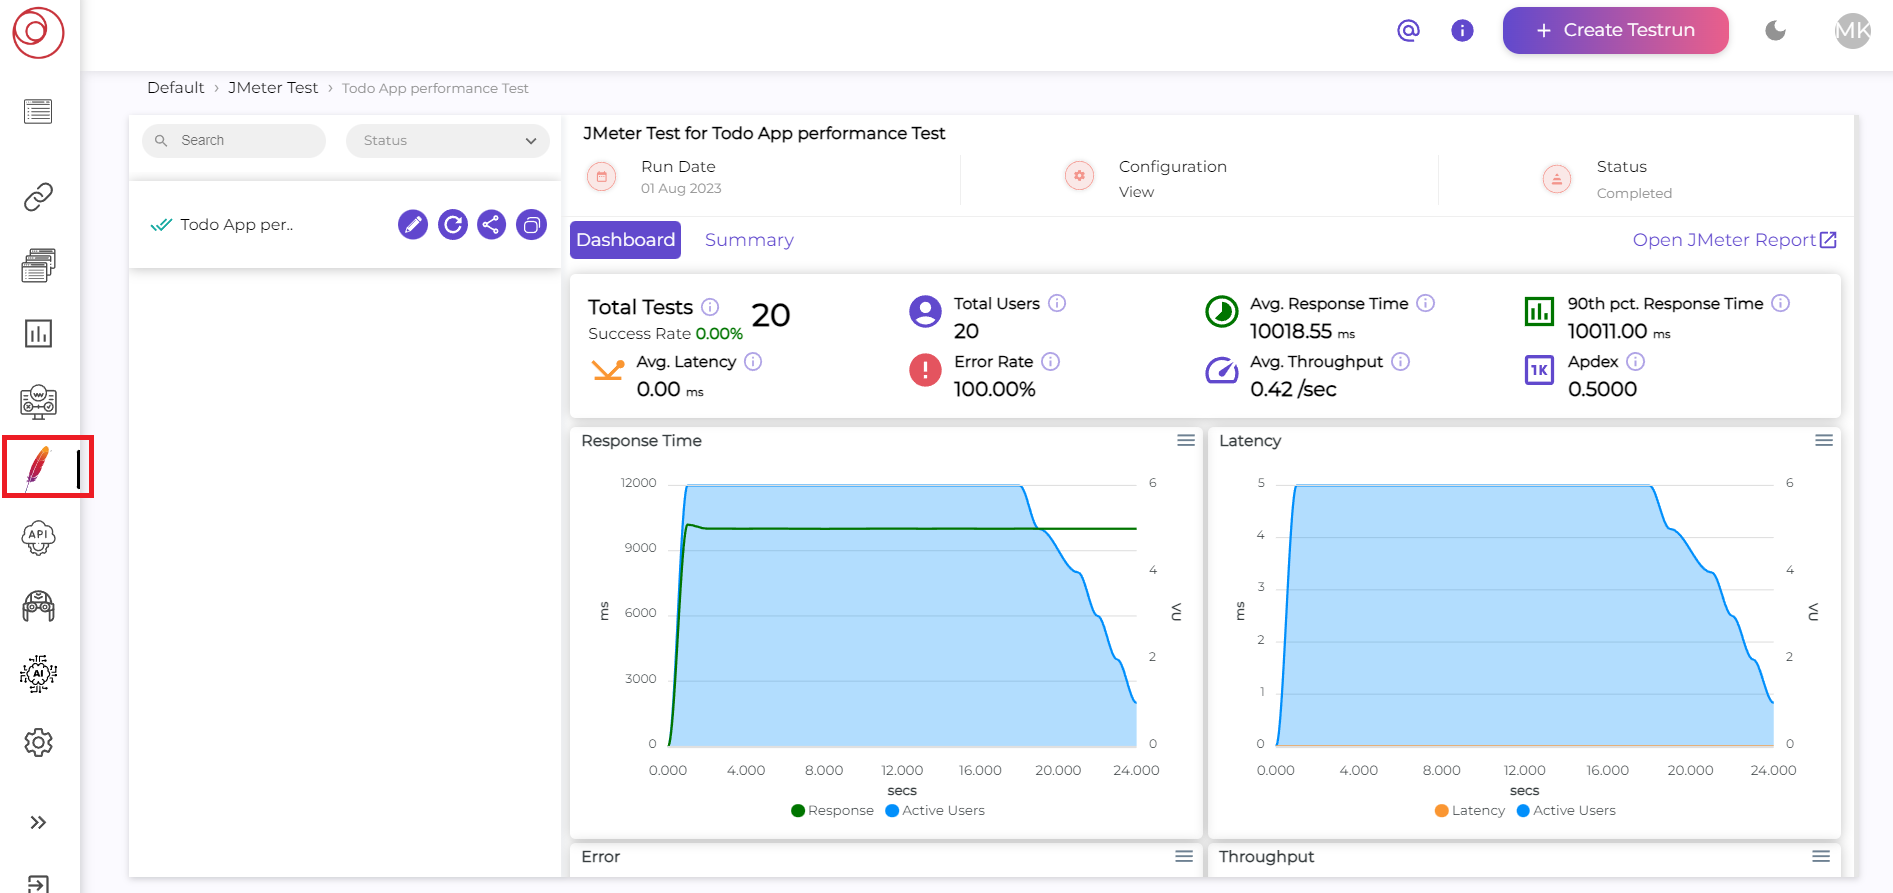
Response time is the total time it takes for a user’s request to be processed, including network latency, server processing time, and response transmission time.Latency is the time it takes for data to travel between the client and server, excluding server processing time.Throughput measures the system’s capacity to handle a certain number of requests or transactions per unit of time, providing insights into its performance under load.
- Once you have reached the JMeter Test dashboard page of aiTest, For more detailed information, click on the
Open JMeter Report associated with the completed testrun.
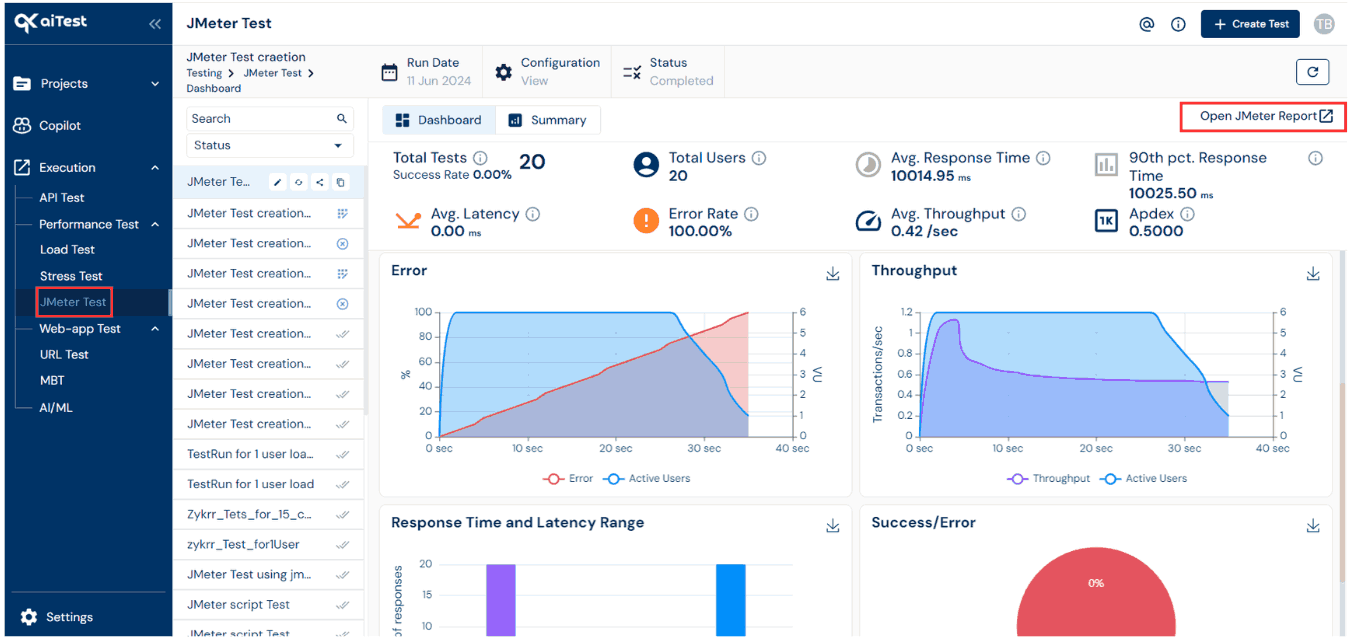
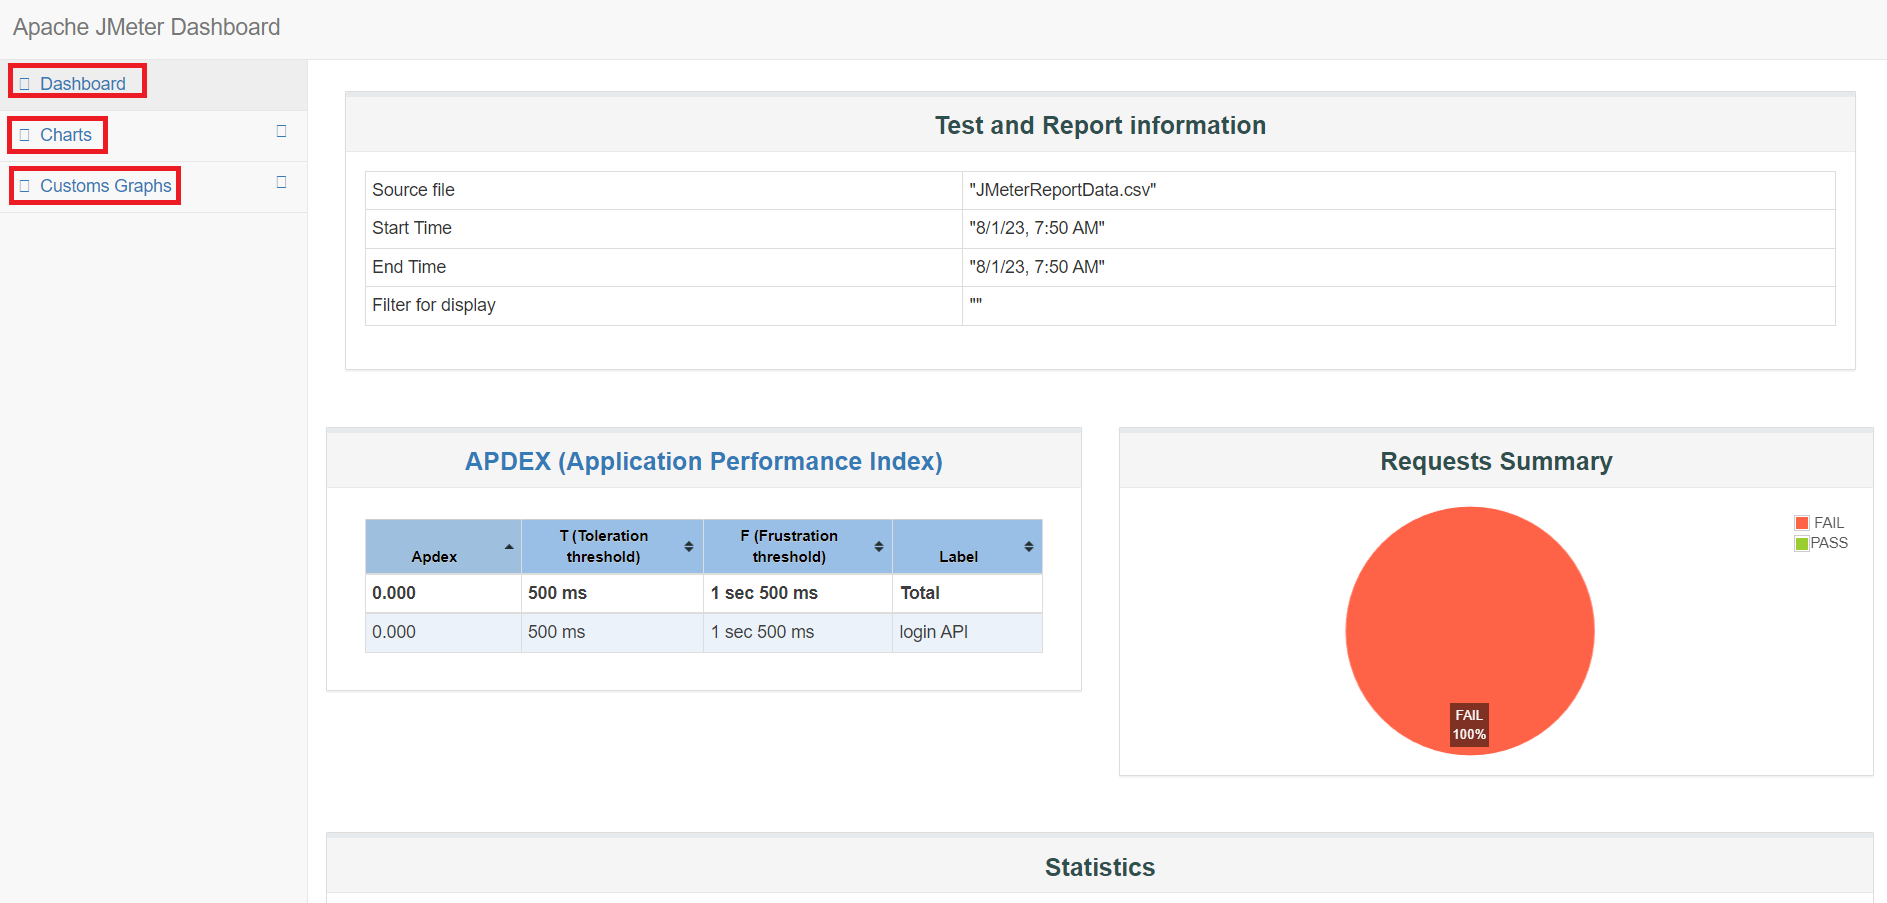
- In JMeter Report You’ll find options to view
Dashboard, Charts and Customs Graphs.
Questions answered
- What is JMeter Test?
- How to use aiTest for JMeter Testing?