UI test analysis in aiTest brings significant business value, including enhanced user experience, bug detection and prevention, cross-browser and device compatibility, visual regression testing, performance optimization, brand consistency, and time and cost savings.
- Sign up using your E-mail or Google account.
- Go to
Multi-Browser Test
- Hit the Create Test button.
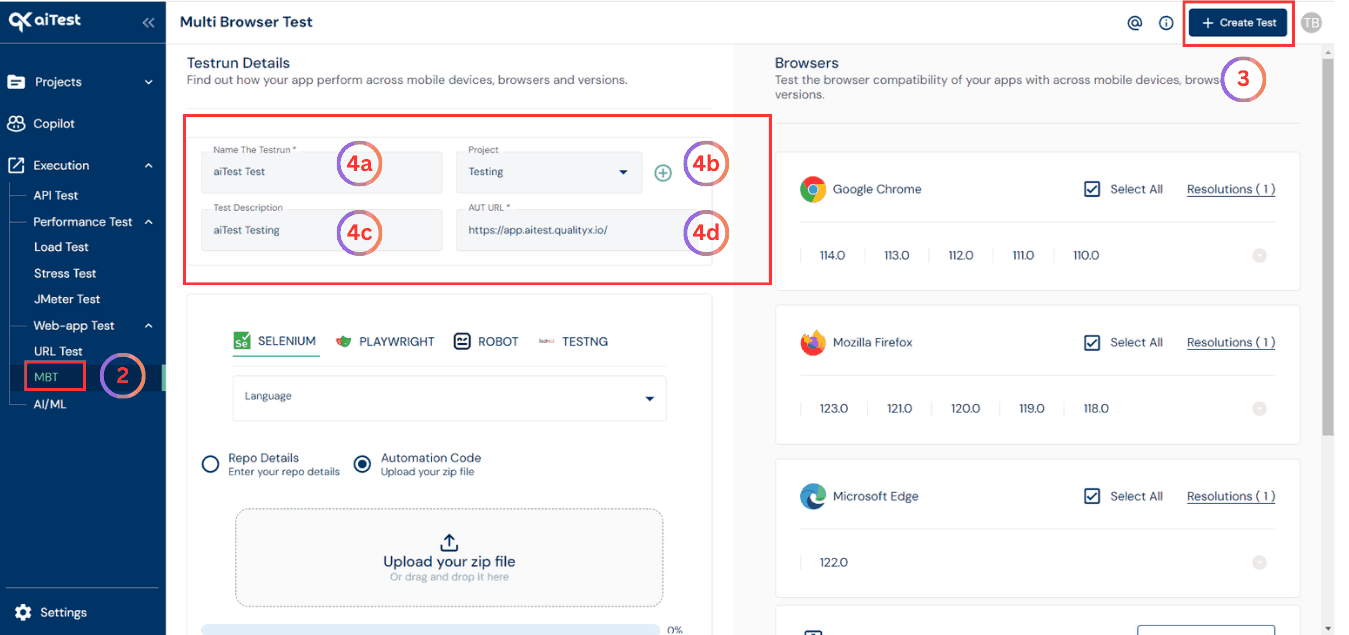
- Configure your test:
- a)Name the testrun: Give the name of testrun whatever you want or which is related to your application, So that it will be easy to get that particular testrun details whenever you want. i.e. test-example.com, test-demo.com, etc.
- b)Project: Select a project in which you want to run your test or you can create a project by clicking on the red colored plus sign(+) button.
- c)Testrun Description: Write some testrun description to make your testrun more informative.
- d)AUT URL: Application Under Test URL. e.g. https://example.com
- e) Select language from language option
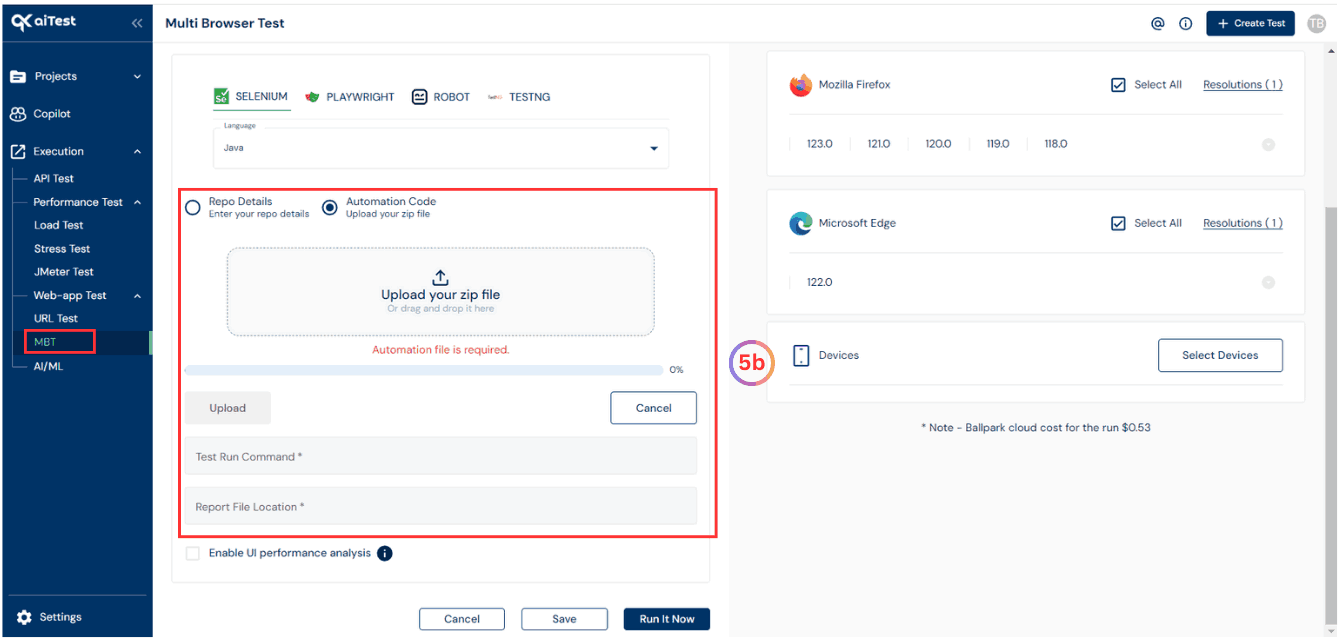
- Now here you can choose Repo Details or Your Automation Code.
- a)Repo Details: Provide the repo details User’s Git Repository URL, User’s Git Username, User’s Git Token or Password,Branch Name, Report File Location and Testrun Command.
- b)Your Automation Code: If you select “Your Automation Code” in the previous step, you will need to upload your automation code in a zip file. and enter Report File Location and Testrun Command.
- c)Select Browsers: At the end select the browser on which you want to run your test. Currently, we have 3 browsers such as, Google Chrome, Mozilla Firefox and Microsoft Edge with their different browser versions, and 9 different mobile devices such as iPhone 12 Pro, iPhone X, Pixel 5, Samsung Galaxy S8+, Samsung Galaxy S20 Ultra, iPad, iPad Mini, iPad Air and iPad Pro.
- Click on
Enable UI Performance Analysis checkbox (If your automation code lacks the ability to capture network logs, you can enhance it by incorporating Java dependencies and utilizing the code snippets provided in our ‘How To’ guide, ensuring compatibility with your automation code.) Your Automation Code Compatible
- Once you are done with the above steps click on :
- Run It Now: Immediately run the automation code to test the browser compatibility of your apps with across mobile devices, browsers and versions.
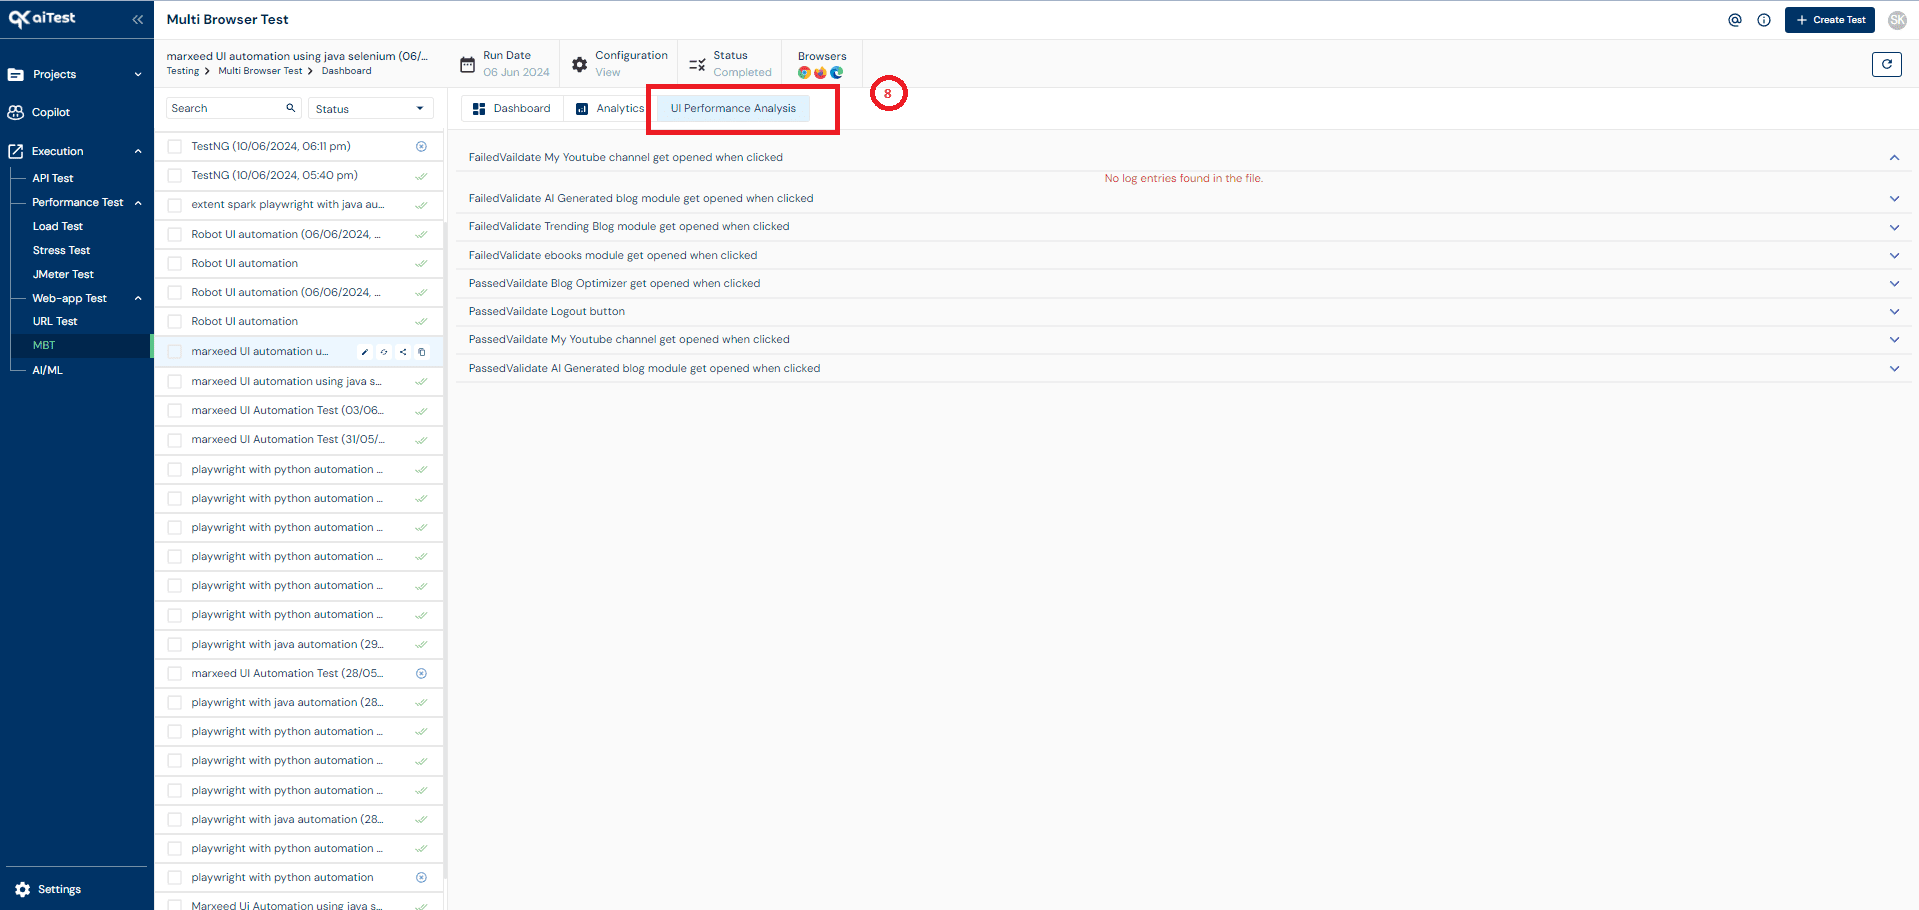
- Click on
UI Performance Analysis option on dashboard.
- Select the test scenario and you will find logs just like the chrome developer tools.
Note
- To get this kind of Performance Analysis data you need to make your java automation code compatible by using below link:
Make Your Code Compatible
Reading The Logs
- The logs give a call by call description of the page and the ApI’s. All of these logs are of drop-down kind, which provide more information on expading.
Questions Answered
- How can I debug UI Performance Analysis?